The dynamics of supply and demand in the stock market, especially as they relate to a stock’s price action. The sources equate the stock market to an auction marketplace. The most important principle of an auction market is the law of supply and demand. Charts can help an investor determine if a stock is under accumulation (being bought in size) or distribution (being sold in size) by analyzing price and volume. For example:
- When there is a lot of supply of a stock, even large demand may not increase the price significantly.
- When there is little supply of a stock, even a small amount of demand can drive the price up rapidly.
The sources refer to a period of consolidation as a time when the stock’s price is relatively stable, moving sideways instead of up or down. This is a time when the stock is “digesting” previous gains. During consolidation, supply is absorbed as strong investors replace weak traders. As a stock corrects, or goes down in price, buyers who purchased the stock at a higher price become “trapped”. These trapped buyers contribute to overhead supply, as they are eager to sell as soon as they can break even. As the stock price increases, short-term profit takers also sell to lock in their gains, adding to the supply. This selling can cause a pullback in price on the right side of the base.
The sources state that an astute investor should wait to buy until after a stock has gone through a normal process of changing hands from weak holders to stronger holders. The ideal time to buy is when supply has stopped coming to the market. This is evidenced by quieter price action and significantly contracted trading volume on the right side of the base.
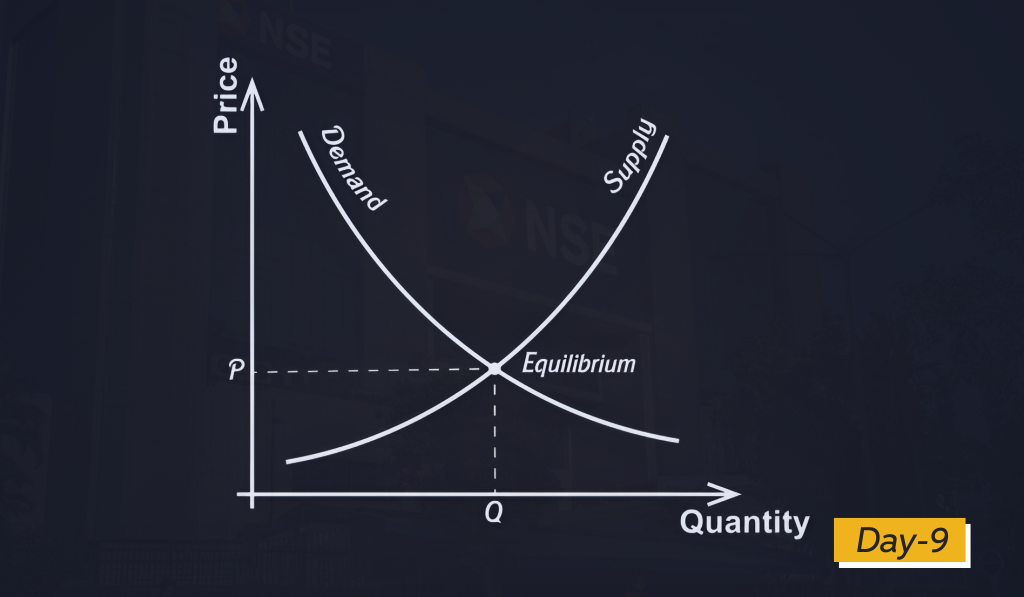
The law of supply and demand influences the price of everything, including stocks. This law dictates that the price of an item, whether it be bikes, cars, tomatoes, or shares of a company, depends on the amount available and the number of people who want it. Even in communist countries where economic equality was supposedly the norm, supply and demand still reigned, often resulting in shortages of state-owned goods or exorbitant prices on the black market.
In the stock market, supply and demand is more important than all the opinions of Wall Street analysts combined. A company with a large number of shares outstanding (large supply) requires a massive volume of buying (demand) to significantly increase the stock price. Conversely, a company with a relatively small number of shares outstanding requires less buying to push the price up. Professionals also look at “floating supply,” which is the number of shares available for purchase after subtracting closely held stock.
Companies where management owns a large percentage of the stock are generally better prospects because they have a vested interest in the company’s success.
There are other reasons, besides supply and demand, why companies with a large number of shares outstanding frequently underperform:
- Older, Slower Growing Companies: These companies are often too big and sluggish to achieve rapid growth.
- Management Layers: Communication is hindered as multiple management layers separate senior executives from customer-level activities.
- Innovation Lag: Large companies often struggle to keep up with the rapid pace of innovation and may lose market share to smaller, more agile competitors.
New products and services frequently come from young, hungry, and innovative small- to medium-sized companies with entrepreneurial management. The best way to measure supply and demand in the stock market is by watching daily trading volume. many websites provide valuable tools to track this, including:
- Volume Percent Change: This shows the percentage change in volume compared to the average daily volume over the last three months.
- Accumulation/Distribution Rating: This gauges whether a stock is under accumulation (buying) or distribution (selling) in the last 13 weeks.
When a stock pulls back in price, ideally, the volume will dry up (decreased supply), indicating that selling pressure is waning. Conversely, when the stock price rallies, an increase in volume (demand) often indicates institutional buying.
When a stock breaks out of a price consolidation area (base), volume should increase by at least 40% to 50% above normal. Increases of 100% or more can indicate solid buying and potential for further price gains. Daily and weekly charts are essential tools for analyzing price and volume action.
But it is important to note that small-cap stocks are substantially more volatile than large-cap stocks. Companies that are buying back their stock and have significant management ownership are generally preferred.
Understanding supply and demand means understanding the heartbeat of financial markets.
“Price is what you pay. Value is what you get.” – Warren Buffett