Volume is a critical component in technical analysis, often used to confirm price trends and identify potential reversals. It represents the total number of entities traded during a specific period, such as the number of shares or contracts. This article will explore the importance of volume, how it is measured, its role as a secondary indicator, and how it interacts with price movements to provide valuable insights for traders.
What is Volume?
- Volume is the total amount of trading activity within a market during a specific time frame.
- It reflects the number of shares or contracts that have changed hands, indicating the level of participation and interest in the market.
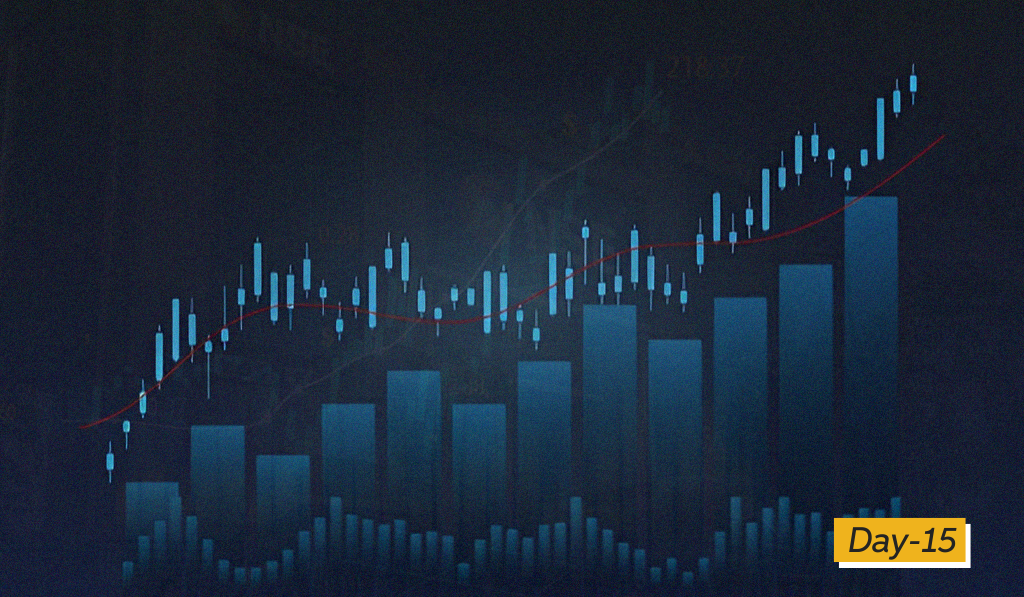
- Volume is typically displayed as a vertical bar at the bottom of a price chart. A higher bar indicates a higher volume of trading activity.
- Volume is a secondary indicator, primarily used to confirm price action.
How is Volume Measured?
Volume is measured differently depending on the market:
- Stocks: Volume is the total number of shares that change hands within a given period.
- Futures: Volume represents the number of contracts that are traded during a specified period.
- Total Volume: In futures, total volume figures for each commodity market are used for forecasting purposes.
Volume as a Secondary Indicator
While price is the most critical element in technical analysis, volume provides essential confirmation of price trends. Here’s how:
- Confirmation of Price Trends: Volume should increase or expand in the direction of an existing price trend.
- Uptrends: As prices rise, volume should also increase, indicating strong buying pressure and confidence in the uptrend.
- Downtrends: As prices fall, volume should increase, confirming strong selling pressure and reinforcing the downtrend.
- Divergence: Divergence occurs when a price trend is not confirmed by volume. This often signals that the trend may be weakening. For example:
- If the price is making new highs, but volume is decreasing, this could be a warning that the uptrend is losing momentum.
- Intensity of Price Movements: Heavier volume reflects a higher degree of intensity or urgency behind price movements, gauging buying or selling pressure.
Volume in Different Market Conditions
The role of volume varies across different market conditions:
- Breakouts: Breakouts occur when prices move beyond support or resistance levels.
- Breakaway Gaps: Volume should be heavy during a breakaway gap, signaling a potential major market move.
- Reversal Patterns: Volume plays a significant role in confirming reversal patterns. For instance, in a head and shoulders top:
- The left shoulder is typically accompanied by heavier volume, followed by a decline to a low point.
- The head sees lighter volume compared to the left shoulder, but is still significant.
- The right shoulder forms with lower volume than the head.
- A decisive break below the neckline is seen with a noticeable increase in volume.
- In a head and shoulders bottom (inverse), the breakout of the neckline should be accompanied by a surge of volume.
- Continuation Patterns: Volume behavior also provides insight into continuation patterns:
- Triangles: Volume typically diminishes as price swings narrow within a triangle. A breakout should then be accompanied by a significant increase in volume.
- Flags and Pennants: These continuation patterns show a dramatic drop off in volume during the consolidation, with a sudden burst of volume on the upside breakout.
- Measured Move: When the price retraces to a certain level in a trend and resumes the trend, the chartist measures the initial move and expects the move to duplicate that same length after the retracement. In a measured move volume is heavier during the bounces and lighter on dips.
- Range-bound Markets: In range-bound markets, volume can be used to trade swings by buying dips near the bottom of the range and selling rallies near the top.
The Importance of Volume in Futures Markets
Volume plays a crucial role in futures trading due to the high leverage and shorter time frames.
- Timing: In futures trading, timing entry and exit points is essential. Volume helps determine the conviction behind price movements, making timing more effective.
- Limited Life Span: Futures contracts have expiration dates, necessitating constant monitoring and analysis using volume.
- Margin: Futures trading involves higher leverage. Relatively small price moves can lead to large gains or losses. Volume helps to avoid entering losing positions.
Volume in Relation to Other Technical Analysis Tools
Volume is not used in isolation. Here’s how it interacts with other aspects of technical analysis:
- Price Charts: Volume is displayed beneath the price action on the chart.
- Bar Charts: On a bar chart, volume is represented by vertical bars below the price bars.
- Candlestick Charts: Volume bars are also displayed in conjunction with candlestick charts.
- Trendlines: The relation between volume and trendlines helps to confirm trends. For example, high volume at a trendline breakout suggests a valid break.
- Moving Averages: Volume can confirm the effectiveness of moving average crossovers or penetrations .
- Oscillators: Volume can be used in conjunction with oscillators. For example, a rising RSI in an overbought area will confirm that the price is likely to keep rising, especially on high volume .
- Support and Resistance: Volume often increases at support and resistance levels. When support becomes resistance, or vice versa, volume analysis can help confirm the new resistance levels.
Common Pitfalls and Considerations
- Self-Fulfilling Prophecy: Some traders believe that the use of technical indicators, including volume, can become a self-fulfilling prophecy.
- Subjectivity: Chart reading, including the interpretation of volume, can be subjective. This can lead to different interpretations by different analysts.
- False Signals: Volume is not infallible. Traders should use volume in conjunction with other indicators and techniques to reduce the risk of false signals.
Conclusion
Volume is a vital tool in technical analysis that helps traders confirm price trends, identify potential reversals, and assess the conviction behind market movements. It is measured by the number of shares or contracts traded and should be used as a secondary indicator to confirm price action. By understanding how volume interacts with price movements, traders can make more informed decisions and improve their trading strategies. While volume is not a perfect tool, its proper interpretation, combined with other technical indicators, is essential for successful market analysis and trading.